| 1 comments ]

Very often I do need to configure NIC teams with HP hardware with Cisco or Procurve networking infrastructure therefore I would like to share an general overview of the NIC HP teaming capabilities, general teaming algorithms and especially how to configure an Cisco or Procurve switches.
My personal preferred teaming mode here is to use the 802.3ad teaming mode as it provides most redundancy and performance throughput capabilities and is the current industry standard which is well understood by enterprise switches.
image
image
HP generally provides following NIC teaming capabilities and algorithms:
1.1 Network Fault Tolerance (NFT) only – Network Fault Tolerance (NFT) is the foundation of HP ProLiant Network Adapter Teaming. In NFT mode, from two to eight teamed ports are teamed together to operate as a single virtual network adapter. However, only one teamed port—the primary teamed port—is used for both transmit and receive communication with the server. The remaining adapters are considered to be stand-by (or secondary adapters) and are referred to as non-primary teamed ports. Non-primary teamed ports remain idle unless the primary teamed port fails. All teamed ports may transmit and receive heartbeats, including non-primary adapters.
The fault-tolerance feature that NFT represents for HP ProLiant Network Adapter Teaming is the only feature found in every other team type. The foundation of every team type supports NFT.
1.2 Network Fault Tolerance (NFT) with Preference Order – Network Fault Tolerance Only with Preference Order is identical in almost every way to NFT with the only difference being that this team type allows the SA to prioritize the order in which teamed ports should be the primary teamed port. This ability is important in environments where one or more teamed ports are more preferred than other ports in the same team. The need for ranking certain teamed ports better than others can be a result of unequal speeds, better adapter capabilities (for example, higher receive/transmit descriptors or buffers, interrupt coalescence, and so on), or preference for the team’s primary port to be located on a specific switch.
1.3 Transmit Load Balancing (TLB) with Fault Tolerance – Transmit Load Balancing with Fault Tolerance (TLB) is a team type that allows the server to load balance its transmit traffic. TLB is switch independent and supports switch fault tolerance by allowing the teamed ports to be connected to more than one switch in the same LAN. With TLB, traffic received by the server is not load balanced. The primary teamed port is responsible for receiving all traffic destined for the server. In case of a failure of the primary teamed port, the NFT mechanism ensures connectivity to the server is preserved by selecting another teamed port to assume the role.
1.4 Transmit Load Balancing (TLB) with Fault Tolerance and Preference Order – Transmit Load Balancing with Fault Tolerance and Preference Order is identical in almost every way to TLB with the only difference being that this team type allows the SA to prioritize the order in which teamed ports should be the primary teamed port. This ability is important in environments where one or more teamed ports are more preferred than other ports in the same team. The need for ranking certain teamed ports higher than others can be a result of unequal speeds, better adapter capabilities (for example, higher receive/transmit descriptors or buffers, interrupt coalescence, and so on), or preference for the team’s primary port to be located on a specific switch.
1.5 Switch-assisted Load Balancing (SLB) with Fault Tolerance – Switch-assisted Load Balancing with Fault Tolerance (SLB) is a team type that allows full transmit and receive load balancing. SLB requires the use of a switch that supports some form of Port Trunking (for example, EtherChannel, MultiLink Trunking, and so on). SLB does not support switch redundancy because all ports in a team must be connected to the same switch. SLB is similar to the 802.3ad Dynamic team type.
1.6 802.3ad Dynamic with Fault Tolerance – 802.3ad Dynamic with Fault Tolerance is identical to SLB except that the switch must support the IEEE 802.3ad dynamic configuration protocol called Link Aggregation Control Protocol (LACP). In addition, the switch port, to which the teamed ports are connected, must have LACP enabled. The main benefit of 802.3ad Dynamic is that an SA will not have to manually configure the switch. 802.3ad Dynamic is a standard feature of HP ProLiant Network Adapter Teaming.
1.7 Automatic (both) – The Automatic team type is not really an individual team type. Automatic teams decide whether to operate as an NFT, or a TLB team, or as an 802.3ad Dynamic team. If all teamed ports are connected to a switch that supports the IEEE 802.3ad Link Aggregation Protocol (LACP) and all teamed ports are able to negotiate 802.3ad operation with the switch, then the team will choose to operate as an 802.3ad Dynamic team. However, if the switch does not support LACP or if any ports in the team do not have successful LACP negotiation with the switch, the team will choose to operate as a TLB team. As network and server configurations change, the Automatic team type ensures that HP ProLiant servers intelligently choose between TLB and 802.3ad Dynamic to minimize server reconfiguration.
2. Load Balancing Algorithm
All load-balancing team types (TLB, SLB, and 802.3ad Dynamic) load balance transmitted frames. There is a fundamental decision that must be made when determining load balancing mechanisms: whether or not to preserve frame order.
Frame order preservation is important for several reasons – to prevent frame retransmission because frames arrive out of order and to prevent performance-decreasing frame reordering within OS protocol stacks. In order to avoid frames from being transmitted out of order when communicating with a target network device, the team’s load-balancing algorithm assigns “outbound conversations” to a particular teamed port. In other words, if frame order preservation is desired, outbound load balancing by the team should be performed on a conversation-by-conversation basis rather than on a frame-by-frame basis. To accomplish this, the load-balancing device (either a team or a switch) needs information to identify conversations. Destination MAC address, Destination IP address, and TCP Connection are used to identify conversations.
It is very important to understand the differences between the load-balancing methods when deploying HP ProLiant Network Adapter Teaming in an environment that requires load balancing of routed Layer 3 traffic. Because the methods use conversations to load balance, the resulting traffic may not be distributed equally across all ports in the team. The benefits of maintaining frame order outweigh the lack of perfect traffic distribution across teamed ports’ members. Implementers of HP ProLiant Network Adapter Teaming can choose the appropriate load balancing method via the NCU.
 clip_image002
2.1 TLB Automatic method
Automatic is a load-balancing method that is designed to preserve frame ordering.
This method will load balance outbound traffic based on the highest layer of information in the frame. For instance, if a frame has a TCP header with TCP port values, the frame will be load balancing by TCP connection (see “TLB TCP Connection method” below). If the frame has an IP header with an IP address but no TCP header, then the frame is load balanced by destination IP address (see “TLB Destination IP Address method” below). If the frame does not have an IP header, the frame is load balanced by destination MAC address (see “TLB Destination MAC Address method” below).
2.2 TLB TCP Connection method
TCP Connection is also a load-balancing method that is designed to preserve frame ordering.
This method will load balance outbound traffic based on the TCP port information in the frame’s TCP header. This load-balancing method combines the TCP source and destination ports to identify the TCP conversation. Combining these values, the algorithm can identify individual TCP conversations (even multiple conversations between the team and one other network device). The algorithm used to choose which teamed port to use per TCP conversation is similar to the algorithms used in the “TLB Destination IP Address method” and “TLB Destination MAC Address method” sections below.
If this method is chosen, and the frame has an IP header with and IP address but not a TCP header, then the frame is load balanced by destination IP address (see “TLB Destination IP Address method” below). If the frame does not have an IP header, the frame is load balanced by destination MAC address (see “TLB Destination MAC Address method” below).
2.3 TLB Destination IP Address method
Destination IP Address is a load-balancing method that will attempt to preserve frame ordering.
This method makes load-balancing decisions based on the destination IP address of the frame being transmitted by the teaming driver. The frame’s destination IP address belongs to the network device that will ultimately receive the frame. The team utilizes the last three bits of the destination IP address to assign the frame to a port for transmission.
Because IP addresses are in decimal format, it is necessary to convert them to binary format. For example, an IP address of 1.2.3.4 (dotted decimal) would be 0000 0001.00000010.00000011.0000 0100 in binary format. The teaming driver only uses the last three bits (100) of the least significant byte (0000 0100 = 4) of the IP address. Utilizing these three bits, the teaming driver consecutively assigns destination IP addresses to each functional network port in its team starting with 000 being assigned to network port 1, 001 being assigned to network port 2, and so on. Of course, how the IP addresses are assigned depends on the number of network ports in the TLB team and how many of those ports are in a functional state (see Table 4-4).
clip_image004
3. How to configure 802.3ad with Cisco and HP Procurve?
3.1 Configuration of Cisco Switch with 2 network ports
Switch#conf ter
Switch(config)#Int PORT (a.e. Gi3/1)
Switch(config-if)#switchport mode access
Switch(config-if)#spanning-tree portfast
Switch(config-if)#channel-group <48> mode active
Switch(config-if)#Int PORT (a.e. Gi3/1)
Switch(config-if)#switchport mode access
Switch(config-if)#spanning-tree portfast
Switch(config-if)#channel-group <48> mode active
3.2 Configuration of HP Procurve with 2 network ports
PROCURVE-Core1#conf ter
PROCURVE-Core1# trunk PORT1-PORT2 (a.e. C1/C2) Trk<ID> (a.e. Trk99) LACP
PROCURVE-Core1# vlan <VLANID>
PROCURVE-Core1# untagged Trk<ID> (a.e. Trk99)
PROCURVE-Core1# show lacp
PROCURVE-Core1# show log lacp
a.e.: How to add additional ports to an existing HP trunk?
image
Note: In this example I do add port D5 and D6 to an configured trunk with trunk ID 70. In total I do have here an 4 port NIC team with ports C23, C24, D5, D6 based on LACP.
3.3 Configuration of HP NIC
clip_image006
NOTE: Automatic can also be used, as the teaming network drivers will automatically detect and handle the best teaming method with the switches => 802.3ad Dynamic Fault Tolerance
image
image
3.4 Results in “sh running-config” in Cisco Example
interface GigabitEthernet3/1
description SERVERNAME-NIC1
switchport access vlan <VLANID>
switchport mode access
spanning-tree portfast
channel-group 60 mode active
interface GigabitEthernet3/2
description SERVERNAME-NIC2
switchport access vlan <VLANID>
switchport mode access
spanning-tree portfast
channel-group <1-48> mode active
interface Port-channel<1-48>
description SERVERNAME-TEAM1
switchport
switchport access vlan <VLANID>
switchport mode access

3.5 Results in “sh int status” in Cisco Example
Gi3/1 SERVERNAME-NIC1 connected 10 a-full a-1000
Gi3/2 SERVERNAME-NIC2 connected 10 a-full a-1000
Po60 SERVERNAME-TEAM1 connected 10 a-full a-1000
Note: In this example the network ports Gi3/1 and Gi3/2 are bound to an new PortChannel (Po60) which is created and connected to VLAN10.

4. References
IMPORTANTE: In NIC Teaming with HP hardware scenarios especially when Hyper-V is involved it is important to follow the installation guide from the NIC manufacturer, in case of HP NCU it is mainly important to strictly follow the installation order:
1. Install OS + patches
2. Install Hyper-V role
3. Install NCU (Network Configuration Utility) (included in Proliant Support Pack, current version 8.70)
More detailed steps can you find in the HP reference guide here:
Using HP ProLiant Network Teaming Software with Microsoft® Windows® Server 2008 (R2) Hyper-V  (4th Edition)
http://h20000.www2.hp.com/bc/docs/support/SupportManual/c01663264/c01663264.pdf
Note: Please be aware most of this blog post are cross-references from HP and Cisco networking documentation.

Refer to http://ramazancan.wordpress.com/

| 0 comments ]

Contents
1 - Summary
2 - Dependencies
3 - NfSen installation
4 - Service configuration
5 - View status on website
6 - Service check

1 - Summary

This guide will show you how to install nfsen in Red Hat Enterprise Linux.
NfSen is used to display and query netflow data. In this guide, nfsen will be
installed and served by apache so information can be viewed in a web browser.
This has been tested in Red Hat Enterprise Linux 5 x86_64.

2 - Dependencies

Add the EPEL repository. This repository contains extra packages from Red Hat.
# wget http://download.fedora.redhat.com/pub/epel/$rel/$arch/epel-release-$ver.noarch.rpm
# sudo rpm -ivh epel-release-$ver.noarch.rpm
[sudo] password for user:
# rm -f epel-release-$ver.noarch.rpm

Install the apache package. Apache is a web server that will host the web pages
that display the netflow data.
# sudo yum install httpd.x86_64
[sudo] password for user:

Find where the apache daemon was installed to.
# rpm -ql httpd-* | grep sbin
/usr/sbin/apachectl
/usr/sbin/htcacheclean
/usr/sbin/httpd
/usr/sbin/httpd.event
/usr/sbin/httpd.worker
/usr/sbin/httxt2dbm
/usr/sbin/rotatelogs
/usr/sbin/suexec

Enable the apache service so that it will start when the system starts up.
# sudo /sbin/chkconfig httpd on
[sudo] password for user:
# sudo /sbin/chkconfig --list httpd
[sudo] password for user:
httpd           0:off   1:off   2:on    3:on    4:on    5:on    6:off

Find where the configuration file should be put.
# rpm -ql httpd-* | grep init.d
/etc/rc.d/init.d/httpd
# grep httpd.conf /etc/rc.d/init.d/httpd
# config: /etc/httpd/conf/httpd.conf
        CONFFILE=/etc/httpd/conf/httpd.conf
# strings /usr/sbin/httpd | grep httpd.conf
-D SERVER_CONFIG_FILE="conf/httpd.conf"
conf/httpd.conf
        directive in your httpd.conf file to list a non-root

You will need to modify the original configuration file. Add the following. In
this example, I set the websites to be stored in an alernate directory. By the
way, there is already a group named it which includes an account for the web
developers.
  ServerName server.test.com
  DocumentRoot "/data/websites/test/server"
  ErrorLog syslog
  LogFormat "%v:%p %h %l %u %t \"%r\" %>s %b \"%{Referer}i\" \"%{User-Agent}i\"" commonvhost
  CustomLog "|/usr/bin/logger" commonvhost
  #Alias /icons/ "/var/www/icons/"
  #<Directory "/var/www/icons">
  #    Options Indexes MultiViews
  #    AllowOverride None
  #    Order allow,deny
  #    Allow from all
  #</Directory>
  #ScriptAlias /cgi-bin/ "/var/www/cgi-bin/"
  #<Directory "/var/www/cgi-bin">
  #    AllowOverride None
  #    Options None
  #    Order allow,deny
  #    Allow from all
  #</Directory>
  #Alias /error/ "/var/www/error/"
  ErrorDocument 404 /index.html
  NameVirtualHost *:80
  NameVirtualHost *:443
  <VirtualHost *:80>
          ServerName server.test.com
          Redirect / https://server.test.com/
  </VirtualHost>
  <VirtualHost *:443>
          ServerName server.test.com
          ServerAdmin root@localhost
          DocumentRoot /data/websites/test/server
  </VirtualHost>
# rpm -ql httpd-* | grep "httpd\.conf"
/etc/httpd/conf/httpd.conf
# sudo cp /etc/httpd/conf/httpd.conf /etc/httpd/conf/httpd.conf.example
[sudo] password for user:
# sudo vi /etc/httpd/conf/httpd.conf
[sudo] password for user:
# sudo mkdir -p /data/websites/test/server
[sudo] password for user:
# sudo mkdir -p /data/logs/httpd
[sudo] password for user:
# sudo chown -R root:it /data/logs/httpd/
[sudo] password for user:

Install the mod_ssl package for SSL certificate support. Copy in the SSL
certificate files to /etc/httpd/ssl/.
# sudo yum install mod_ssl.x86_64
[sudo] password for user:
# sudo mkdir /etc/httpd/ssl/
[sudo] password for user:
You will need to modify the original configuration file. Add the following.
  #SSLPassPhraseDialog  builtin
  ErrorLog syslog
  SSLCertificateFile /etc/httpd/ssl/test.cer
  SSLCertificateKeyFile /etc/httpd/ssl/test.key.alt
  SSLCertificateChainFile /etc/httpd/ssl/test.crt
# rpm -ql mod_ssl-* | grep conf.d
/etc/httpd/conf.d/ssl.conf
# sudo cp /etc/httpd/conf.d/ssl.conf /etc/httpd/conf.d/ssl.conf.example
[sudo] password for user:
# sudo vi /etc/httpd/conf.d/ssl.conf
[sudo] password for user:
Create an index file.
  <html>
  <head>
  <title>Test: Network monitoring</title>
  </head>
  <body>
  <a href="https://server.test.com/nfsen/">Netflow information - NfSen</a><br>
  </body>
  </html>
# sudo vi /data/websites/test/server/index.html
[sudo] password for user:

Configure syslog appropriately.

Install the php package. The php version has to be at least 4.1.
# sudo yum install php.x86_64
[sudo] password for user:
# rpm -ql php-cli-* | grep bin | grep php
/usr/bin/php
/usr/bin/php-cgi
# /usr/bin/php -v | grep built
PHP 5.1.6 (cli) (built: Nov 13 2010 16:05:12)
# sudo rpm -ql php-common-* | grep php.ini
[sudo] password for user:
/etc/php.ini
# sudo cp /etc/php.ini /etc/php.ini.example
[sudo] password for user:
You will need to modify the original configuration file. Have the following.
By the way, we already have a group named it which includes an account for the
web developers.
  error_reporting  =  E_ALL & ~E_NOTICE
  log_errors_max_len = 0
  error_log = /data/logs/php/errors.log
# sudo vi /etc/php.ini
[sudo] password for user:
# sudo mkdir /data/logs/php
[sudo] password for user:
# sudo touch /data/logs/php/errors.log
[sudo] password for user:
# sudo chown -R root:it /data/logs/php/
[sudo] password for user:
# sudo chmod -R 777 /data/logs/php/
[sudo] password for user:

Install the perl package. The perl version has to be at least 5.6.0.
# sudo yum install perl.x86_64
[sudo] password for user:
# rpm -ql perl-* | grep bin | grep perl
/usr/bin/find2perl
/usr/bin/perl
/usr/bin/perl5.8.8
/usr/bin/perlbug
/usr/bin/perlcc
/usr/bin/perldoc
/usr/bin/perlivp
/usr/lib/perl5/5.8.8/unicore/CombiningClass.pl
/usr/lib/perl5/5.8.8/unicore/lib/gc_sc/InCombin.pl
# /usr/bin/perl -v | grep -i built
This is perl, v5.8.8 built for x86_64-linux-thread-multi

Install the following perl modules.
# sudo yum install perl-TimeDate
[sudo] password for user:
# sudo yum install perl-Pod-Escapes
[sudo] password for user:
# sudo yum install perl-Pod-Simple
[sudo] password for user:
# sudo yum install perl-Test-Pod
[sudo] password for user:
# sudo yum install perl-MailTools
[sudo] password for user:

Install the rrdtool packages.
# sudo yum install libdbi.x86_64
[sudo] password for user:
# sudo yum install lua.x86_64
[sudo] password for user:
# sudo yum install mysql-server.x86_64
[sudo] password for user:
# sudo /sbin/chkconfig mysqld off
[sudo] password for user:
# sudo yum install net-snmp-utils.x86_64
[sudo] password for user:
# mkdir nfsen
# cd nfsen/
# wget http://apt.sw.be/redhat/$rel/$lang/$arch/dag/RPMS/perl-rrdtool-$ver.$rel.rf.$arch.rpm
# sudo rpm -ivh --nodeps perl-rrdtool-$ver.$rel.rf.$arch.rpm
[sudo] password for user:
# sudo yum install ruby.x86_64
[sudo] password for user:
# wget http://apt.sw.be/redhat/$rel/$lang/$arch/dag/RPMS/rrdtool-$ver.$rel.rf.$arch.rpm
# sudo rpm -ivh rrdtool-$ver.$rel.rf.$arch.rpm
[sudo] password for user:
# wget http://apt.sw.be/redhat/$rel/$lang/$arch/dag/RPMS/rrdtool-devel-$ver.$rel.rf.$arch.rpm
# sudo rpm -ivh rrdtool-devel-$ver.$rel.rf.$arch.rpm
[sudo] password for user:

Download, compile and install the nfdump application. It can be downloaded at
http://nfdump.sourceforge.net/.
# wget http://$mirror.sourceforge.net/project/nfdump/stable/nfdump-$ver/nfdump-$ver.tar.gz
# tar -zxvf nfdump-$ver.tar.gz
# cd nfdump-$ver/
# ./configure --enable-nfprofile
# make
# sudo make install
[sudo] password for user:
# sudo make clean
[sudo] password for user:
# cd ..

3 - NfSen installation

Dowload the nfsen application and extract it. It can be downloaded at
http://nfsen.sourceforge.net/.
# wget http://$mirror.sourceforge.net/project/nfsen/stable/nfsen-$ver/nfsen-$ver.tar.gz
# tar -zxvf nfsen-$ver.tar.gz
# cd nfsen-$ver/

You can modify the configuration file. Have the following.
  $BASEDIR = "/usr/local";
  $HTMLDIR    = "/var/www/html/nfsen/";
  $VARDIR="/data/monitoring/nfsen";
  $PROFILESTATDIR="${VARDIR}/profiles-stat";
  $PROFILEDATADIR="${VARDIR}/profiles-data";
  $USER    = "nfsen";
  $WWWUSER  = "apache";
  $WWWGROUP = "apache";
  %sources = (
      'core_router_location1'   => { 'port' => '9991', 'col' => '#ff0000' },
      'core_router_location2'   => { 'port' => '9992', 'col' => '#008000' },
      'core_router_location3'   => { 'port' => '9993', 'col' => '#0000ff' },
  );
  $MAIL_FROM   = 'noreply@test.com';
  $SMTP_SERVER = 'mail.test.com';
# cd nfsen-$ver/
# cp etc/nfsen-dist.conf etc/nfsen.conf
# vi etc/nfsen.conf
# sudo mkdir -p /data/monitoring/nfsen
[sudo] password for user:

Modify the install.pl file to include the following. This is around line 200.
          my @out = `$NfConf::PREFIX/nfdump -V`;
  #       if ( scalar @out != 2 ) {
  #               die "Error getting nfdump version";
  #       }
# vi install.pl

Create a user named nfsen.
# sudo /usr/sbin/useradd -c 'NfSen' -d / -g apache -M -s /sbin/nologin nfsen
[sudo] password for user:

Install the nfsen application.
# sudo ./install.pl etc/nfsen.conf
[sudo] password for user:
# cd ~

4 - Service configuration

Find where the nfsen application was installed to.
# grep -E "(\$BASEDIR|\$BINDIR)" nfsen/nfsen-$ver/etc/nfsen.conf | grep -v ^#
$BASEDIR = "/usr/local";
$BINDIR="${BASEDIR}/bin";
# ls -1 /usr/local/bin/nfsen
/usr/local/bin/nfsen

Enable the nfsen service so that it will start when the system starts up. Here
is a script I created to start and stop the nfsen daemon.
  #!/bin/bash

  # chkconfig: - 50 50
  # description: nfsen

  DAEMON=/usr/local/bin/nfsen

  case "$1" in
          start)
                  $DAEMON start
                  ;;
          stop)
                  $DAEMON stop
                  ;;
          status)
                  $DAEMON status
                  ;;
          restart)
                  $DAEMON stop
                  $DAEMON start
                  ;;
          *)
                  echo "Usage: $0 {start|stop|status|restart}"
                  exit 1
                  ;;
  esac
# sudo vi /etc/rc.d/init.d/nfsen
[sudo] password for user:
# sudo chmod 755 /etc/rc.d/init.d/nfsen
[sudo] password for user:
# sudo /sbin/chkconfig --add nfsen
[sudo] password for user:
# sudo /sbin/chkconfig nfsen on
[sudo] password for user:
# sudo /sbin/chkconfig --list nfsen
[sudo] password for user:
nfsen           0:off   1:off   2:on    3:on    4:on    5:on    6:off

Find where the configuration was installed to.
# grep -E "(\$BASEDIR|\$CONFDIR)" nfsen/nfsen-$ver/etc/nfsen.conf | grep -v ^#
$BASEDIR = "/usr/local";
$CONFDIR="${BASEDIR}/etc";
# ls -1 /usr/local/etc/nfsen.conf
/usr/local/etc/nfsen.conf

You will need to modify the original configuration file. Have the following.
  $HTMLDIR    = "/data/websites/test/server/nfsen/";
# sudo cp /usr/local/etc/nfsen.conf /usr/local/etc/nfsen.conf.example
[sudo] password for user:
# sudo vi /usr/local/etc/nfsen.conf
[sudo] password for user:
# sudo mkdir /data/logs/nfcapd/
[sudo] password for user:
# sudo mkdir /data/logs/nfsen/
[sudo] password for user:
# sudo chown -R root:it /data/logs/nfcapd/
[sudo] password for user:
# sudo chown -R root:it /data/logs/nfsen/
[sudo] password for user:

You will need to create a configuration file for nfsen used by apache. Have the
following.
  Alias /nfsen/ "/data/websites/test/server/nfsen/"
  <Directory "/data/websites/test/server/nfsen">
      AuthType Basic
      AuthName "Restricted"
      AuthUserFile /etc/httpd/conf/htaccounts
      Require user Administrator
      DirectoryIndex nfsen.php
      AllowOverride None
      Options None
      Order allow,deny
      Allow from all
  </Directory>
# rpm -ql httpd-* | grep conf.d
/etc/httpd/conf.d
/etc/httpd/conf.d/README
/etc/httpd/conf.d/proxy_ajp.conf
/etc/httpd/conf.d/welcome.conf
# sudo vi /etc/httpd/conf.d/nfsen.conf
[sudo] password for user:

Create a user account using htpasswd that will be allowed to view the netflow
information.
# rpm -ql httpd-* | grep htpasswd
/usr/bin/htpasswd
/usr/share/man/man1/htpasswd.1.gz
# sudo /usr/bin/htpasswd -c -s /etc/httpd/conf/htaccounts Administrator
[sudo] password for user:
New password: ********
Re-type new password: ********
Adding password for user Administrator

Copy the nfsen web directory and set ownership and permissions. By the way,
there is already a group named it which includes an account for the web developers.
# grep "\$HTMLDIR" nfsen/nfsen-$ver/etc/nfsen.conf
$HTMLDIR    = "/var/www/html/nfsen/";
# rm -fr nfsen/
# sudo cp -Rp /var/www/nfsen/ /data/websites/test/server/nfsen/
[sudo] password for user:
# sudo chown -R apache:it /data/websites/test/server/nfsen/
[sudo] password for user:
# sudo chmod -R 774 /data/websites/test/server/nfsen/
[sudo] password for user:

You will need to configure SELinux appropriately. SELinux status can be
found by running sestatus.
# sudo /usr/sbin/sestatus | grep status:
[sudo] password for user:
SELinux status:                 enabled

Before starting the server, make sure that tcp ports 80, 443 and udp ports 9991,
9992, and 9993 are open in case you are running firewall software. Here are
some sample rules.
  -A RH-Firewall-1-INPUT -m state --state NEW -m tcp -p tcp --dport 80 -j ACCEPT
  -A RH-Firewall-1-INPUT -m state --state NEW -m tcp -p tcp --dport 443 -j ACCEPT
  -A RH-Firewall-1-INPUT -p udp -m udp --dport 9991 -j ACCEPT
  -A RH-Firewall-1-INPUT -p udp -m udp --dport 9992 -j ACCEPT
  -A RH-Firewall-1-INPUT -p udp -m udp --dport 9993 -j ACCEPT
# sudo /sbin/service iptables stop
[sudo] password for user:
Flushing firewall rules:                                   [  OK  ]
Setting chains to policy ACCEPT: filter                    [  OK  ]
Unloading iptables modules:                                [  OK  ]
# sudo cp /etc/sysconfig/iptables /etc/sysconfig/iptables.previous
[sudo] password for user:
# sudo vi /etc/sysconfig/iptables
[sudo] password for user:
# sudo /sbin/service iptables start
[sudo] password for user:
Applying iptables firewall rules:                          [  OK  ]
Loading additional iptables modules: ip_conntrack_netbios_n[  OK  ]

Start the apache service.
# sudo /sbin/service httpd start
[sudo] password for user:
Starting httpd: [  OK  ]

Start the nfsen service.
# sudo /sbin/service nfsen start
[sudo] password for user:
Starting nfcapd:(core_router_location1)[12989] (core_router_location3)[12992]
(core_router_location2)[12995]
Starting nfsend.
# sudo /sbin/service nfsen status
[sudo] password for user:
NfSen version: version
NfSen status:
Collector for (core_router_location1) port 9991 is running [12989].
Collector for (core_router_location3) port 9993 is running [12992].
Collector for (core_router_location2) port 9992 is running [12995].
nfsen daemon:  pid: [12997] is running.

5 - View status on website

Navigate your web browser to https://server.test.com/. Click on the link for
Netflow information - NfSen. After you login, you will see a screen showing a
summary of the netflow data.

6 - Service check

Reboot your computer. Log in like normal and check to see that the httpd and
nfsen services are running. That's it, now you have nfsen running in Red Hat
Enterprise Linux.
# sudo /sbin/shutdown -r now
Password:
# sudo /sbin/service httpd status
Password:
httpd (pid  3106) is running...
# sudo /sbin/service nfsen status
Password:
NfSen version: version
NfSen status:
Collector for (core_router_location1) port 9991 is running [2993].
Collector for (core_router_location3) port 9993 is running [2996].
Collector for (core_router_location2) port 9992 is running [2999].
nfsen daemon:  pid: [3001] is running.

Refer to: http://www.packetwatch.net/documents/guides/2010112201.php

| 0 comments ]

This wiki hosts documentation and source code for plugins that can be used with NfSen:

  • NfSen (Netflow Sensor) is a graphical web based front end for the nfdump netflow tools. Learn more at http://nfsen.sf.net
  • Nfdump tools collect and process netflow data on the command line. Learn more at http://nfdump.sf.net
Click on the plugin names below to access documentation, contact authors and submit bugs or functionality requests.
You can also submit a new plugin or a plugin request.

Plugins Available:


SURFmap
Network monitoring tool based on the Google Maps API
  • Download SURFmap
  • Last updated: 2013-08-02
  • Compatibility: Nfsen-1.3.6
  • Dependencies: -

SSHCure
SSH Intrusion Detection System
  • Download SSHCure
  • Last updated: 2013-06-09
  • Compatibility: Nfsen-1.3.6
  • Dependencies: -

Nfsight
Network visualization and client/server detection tool
  • Download Nfsight
  • Last updated: 2011-09-08
  • Compatibility: Nfsen-1.3.4 and later
  • Dependencies: MySQL

PortTracker
Breaks down flow activity reports per port
  • This plugin is provided with Nfsen in the contrib directory. Download Nfsen 1.3.3
  • Last updated: 2010-05-28
  • Compatibility: Nfsen-1.3.3
  • Dependencies: -

Botnet
Sends alerts when botnet related activity is detected based on a list of known botnet C&C

Events
Processes and stores alerts produced by the Botnet plugin
  • Download Events 0.3
  • Last updated: 2008-11-18
  • Compatibility: Nfsen-1.3.1
  • Dependencies: MySQL, Perl modules DBI, DBD::mysql and PHP::Serialization

Events-mail
Sends alerts collected from Events by email

| 0 comments ]

UPDATE: Did you knew there’s an official Cacti guide? Find it at Cacti 0.8 Beginner’s Guide. For more info about SNMP please don’t hesitate to take a look at Essential SNMP, Second Edition.
My previous article was focused on Linux monitoring. Often, you’ll have in your datacenter at least a few Windows machines. SQL Server is one of the best excuses these days to get a Microsoft machine in your server room – and you know what, it’s a decent database – well, at least for medium-sized companies like the one I’m working for right now.
It is less known, but yes you can have SNMP support out of the box with Windows 2000 and XP, and it doesn’t need to be the Server flavor [obiously it works the same in 2003 Server]:
  1. Invoke the Control Panel.
  2. Double click the Add/Remove Programs icon.
  3. Select Add/Remove Windows Components. The Windows Component Wizard is displayed.
  4. Check the Management and Monitoring Tools box.
  5. Click the Details button.
  6. Check the Simple Network Management Protocol box and click OK, then Next. You may have to reboot the machine.
After the server is installed, the SNMP service has to be configured. Here’s how:
  1. Invoke the Control Panel.
  2. Double click the Administrative Tools icon.
  3. Double click the Services icon.
  4. Select SNMP Service.
  5. Choose the Security tab.
  6. Add whatever community name is used in your network. Chances are in a local internal LAN the default public works out of the box.
  7. For a sensitive server, you may want to fiddle a little bit with the IP restriction settings, for instance allowing SNMP communication only with the monitoring machine.
  8. Click OK then restart the service.
Next step is Cacti integration. Unfortunately, there is no Windows-specific profile for devices in Cacti. Therefore if you have lots of Windows machines, you’ll have to define your own. Or, take a Generic SNMP-enabled host and use it as a scaffold for each device configuration.
Out of the graphs and datasources already defined in Cacti [I am using 0.8.6c] only two work with Windows SNMP agents: processes and interface traffic values.
It’s a good start, but if you are serious about monitoring, you need to dig a little bit deeper. Once again, the MIB Browser comes to save the day. It’s very simple, just search on the Windows machine for any .mib files you are able to find, copy on your workstation, load them into the MIB browser and make some recursive walks (Get subtree on the root of the MIB).This way, I was able to find some interesting OID for the Windows machine. For instance, .1.3.6.1.2.1.25.3.3.1.2.1 -> .1.3.6.1.2.1.25.3.3.1.2.4 the OID for CPU load on each of the 4 virtual CPUs [it's a dual Xeon with HT].
Memory-related OIDs for my configuration are :
  • .1.3.6.1.2.1.25.2.3.1.5.6 – Total physical memory
  • .1.3.6.1.2.1.25.2.3.1.6.6 – Used physical memory
  • .1.3.6.1.2.1.25.2.3.1.6.6 – Total virtual memory ["virtual"="swap" in Windows lingo]
  • .1.3.6.1.2.1.25.2.3.1.6.6 – Used virtual memory
Here’s a neat memory chart for a windows machine. Notice that the values are in “blocks” which in my case is 64kb. The total physical memory is 4GB.
Most hardware manufacturers do offer SNMP agents for their hardware, as well as the corresponding .mib file . In my case, I was able to install an agent to monitor an LSI Megaraid controller. Here is a chart for the number of disk operations/second:
In one of my next articles, we’ll take a look together at the way you can export “non-standard” data over SNMP from Windows, in the same manner we did on Linux, using custom scripts. Till then, have an excellent week.

Refer to: http://www.netuality.ro/monitoring-windows-servers-with-snmp/tools/20060512/

| 0 comments ]

UPDATE: Did you knew there’s an official Cacti guide? Find it at Cacti 0.8 Beginner’s Guide. For more info about SNMP please don’t hesitate to take a look at Essential SNMP, Second Edition.
Two free open-source tools are running the show for network and server-activity monitoring. The oldest and quite popular among network and system administrators is Nagios. Nagios does not only do monitoring, but also event traps, escalation and notification. The younger challenger is called Cacti. Unlike Nagios, it’s written in a scripting language [PHP] so no compiling is necessary – it just runs out of the box1. Cacti’s problem is that – at its current version – is missing lots of real-time features such as monitoring and notification. All these features are scheduled to be integrated in future versions of the product, but as with any open-source roadmap nothing is guaranteed, Anyway, this article is focusing on Cacti integration because it’s what I am currently using.
Cacti is built upon an open-source graphing tool called MRTG and a communication protocol SNMP. SNMP is not exactly a developer’s cup of tea, being more of a network administrator’s tool2. However, a monitoring server comes extremely handy in performance measurement and tuning, especially for complex performance behavior which can only be benchmarked long-term : such as large caches impact on a web application, or performance of long-running operations.
But is that specific variable you need to monitor, available with SNMP out of the box ? There is a strong chance it is. SNMP being an extensible protocol, lots of organization have recorded their own MIBs and respective implementations. Basically, a MIB is a group of unique identifiers called OIDs. An OID is a sequence of numbers separated by dots, for instance ‘.1.3.6.1.4.1.2021.11′; each number has a special meaning in a standard object tree – this example, the meaning of ‘.1.3.6.1.4.1.2021.11′ is ‘.iso.org.dod.internet.private.enterprises.ucdavis.systemStats’. Even you can have your own MIB in the ‘.iso.org.dod.internet.private.enterprises’ tree, by applying on this page at IANA.
Most probably you don’t really need your own MIB, no matter how ‘exotic’ your monitoring is, because:
a) it’s already there, in the huge list of existing MIBs and implementations
and
b) you are not bound to the existing official MIBs, in fact you can create your own MIB as long as you replicate it in the snmp configuration on all the servers that you want to monitor.
To take a look at existing MIBs, free tools are available on the net, IMHO the best one being MibBrowser. This multiplatform [Java] MIB browser has a free version which should be more than enough for our basic task. The screen capture shown here depicts a “Get Subtree” operation on the ‘.1.3.6.1.4.1.2021.11′ MIB; the result is a list of single value MIBs, such for instance ‘.1.3.6.1.4.1.2021.11.11.0′ which has the alias ‘ssCpuIdle.0′ and value 97 [meaning that the CPU is 97% idle]. You can see the alias by loading the corresponding MIB file [select File/Load MIB then choose 'UCD-SNMP-MIB.txt' from the list of predefined MIBs].
From command line, in order to display existing MIB values, you can use snmpwalk:
snmpwalk -Os -c [community_name] -v 1 [hostname] .1.3.6.1.4.1.111111.1
3 and the result is:
.1.3.6.1.4.1.2021.11 OID (.iso.org.dod.internet.private.enterprises.ucdavis.systemStats)
snmpwalk -v 1 -c sncq localhost .1.3.6.1.4.1.2021.11
UCD-SNMP-MIB::ssIndex.0 = INTEGER: 1
UCD-SNMP-MIB::ssErrorName.0 = STRING: systemStats
UCD-SNMP-MIB::ssSwapIn.0 = INTEGER: 0
UCD-SNMP-MIB::ssSwapOut.0 = INTEGER: 0
UCD-SNMP-MIB::ssIOSent.0 = INTEGER: 4
UCD-SNMP-MIB::ssIOReceive.0 = INTEGER: 2
UCD-SNMP-MIB::ssSysInterrupts.0 = INTEGER: 4
UCD-SNMP-MIB::ssSysContext.0 = INTEGER: 1
UCD-SNMP-MIB::ssCpuUser.0 = INTEGER: 2
UCD-SNMP-MIB::ssCpuSystem.0 = INTEGER: 1
UCD-SNMP-MIB::ssCpuIdle.0 = INTEGER: 96
UCD-SNMP-MIB::ssCpuRawUser.0 = Counter32: 17096084
UCD-SNMP-MIB::ssCpuRawNice.0 = Counter32: 24079
UCD-SNMP-MIB::ssCpuRawSystem.0 = Counter32: 6778580
UCD-SNMP-MIB::ssCpuRawIdle.0 = Counter32: 599169454
UCD-SNMP-MIB::ssCpuRawKernel.0 = Counter32: 6778580
UCD-SNMP-MIB::ssIORawSent.0 = Counter32: 998257634
UCD-SNMP-MIB::ssIORawReceived.0 = Counter32: 799700984
UCD-SNMP-MIB::ssRawInterrupts.0 = Counter32: 711143737
UCD-SNMP-MIB::ssRawContexts.0 = Counter32: 1163331309
UCD-SNMP-MIB::ssRawSwapIn.0 = Counter32: 23015
UCD-SNMP-MIB::ssRawSwapOut.0 = Counter32: 13730
Each of this values has its own significance, like for instance ‘ssCpuIdle.0′ which announces that the CPU is 96% idle.
In order to retrieve just a single value of the list, use its alias as a parameter to the snmpget command, for instance
snmpget -Os -c [community_name] -v 1 [hostname] UCD-SNMP-MIB::ssCpuIdle.0
Sometimes, you want to monitor something which you do not seem to find in the list of MIBs. Say, for instance, the performance of a MySQL database that your’re pounding pretty hard with your webapp4. The easiest way of doing this is to pass through a script – snmp implementations can take the result of any script and expose it through the protocol, line by line.
Supposing you want to keep track of the values obtained with the following script:
#!/bin/sh
/usr/bin/mysqladmin -uroot status | /usr/bin/awk '{printf("%fn%dn%dn",$4/
10,$6/1000,$9)}'
The mysqladmin command and a bit of simple awk magic display the following three values, each on a separate line:
  • number of opened connections / 10
  • number of queries / 1000
  • number of slow queries
It is interesting to not that, while the first value is instantaneous gauge-like, the following two are incremental, growing and growing as long as new queries and new slow queries are recorded. Will keep this in mind for later, when we will track these values.
But for now, let’s see how these three values are exposed through snmp. The first step is to tell the SNMP daemon that the script has an associated MIB. This is done in the configuration file, usually located at /etc/snmp/snmp.d. The following line attaches the script [for example /home/user/myscript.sh] execution to a certain OID:
exec .1.3.6.1.4.1.111111.1 MySQLParameters /home/user/myscript.sh
the ‘.1.3.6.1.4.1.111111.1′ OID is a branch of ‘.1.3.6.1.4.1′ [meaning '.iso.org.dod.internet.private.enterprises']. We tried to make it look ‘legitimate’ but obviously you can use here any sequence you want to.
After restarting the daemon, let’s interrogate Mibbrowser for the freshly created OID, see the following image snmpwalk -Os -c [community_name] -v 1 [hostname] .1.3.6.1.4.1.111111.1 ; the result is:
enterprises.111111.1.1.1 = INTEGER: 1
enterprises.111111.1.2.1 = STRING: "MySQLParameters"
enterprises.111111.1.3.1 = STRING: "/etc/snmp/mysql_params.sh"
enterprises.111111.1.100.1 = INTEGER: 0
enterprises.111111.1.101.1 = STRING: "0.900000"
enterprises.111111.1.101.2 = STRING: "18551"
enterprises.111111.1.101.3 = STRING: "108"
enterprises.111111.1.102.1 = INTEGER: 0
enterprises.111111.1.103.1 = ""
Great ! Now we have the proof that it really works and our specific values extracted with a custom script are visible through SNMP. Let’s go back to Cacti and see how we can make some nice charts out of them5.
Cacti has this nice feature of defining ‘templates’ that you can reuse afterwards. My strategy is to define a data template for each one of the 3 parameters I want to chart, using the ‘Duplicate’ function applied to the ‘SNMP – Generic OID Template’.
On the duplicate datasource template, you have to change the datasource title, name to display in charts, data source type [use DERIVE for incremental counters and GAUGE for instantaneous values], specific OID and the snmp community. Do it for the three values.
Using the three new datasource templates, create a chart template for ‘MySQL Activity’. That’s a bit more complicated, but it boils down to the following procedure, repeated for each of the 3 data sources:
  • add a data source and associate a graph [I always use AREA for the first graph as a background and LINE3 for the other, but it's just a matter of taste]
  • associate labels with current or computed values: CURRENT, AVERAGE, MAX in this example
All the rest is really fine tuning – deciding for better colors, wether to use autoscale or fixed scale and so on. By now, your graph template should be ready to use.
Note that for the incremental values ['DERIVE' type data sources] I’ve used titles such as ‘Thousands queries/5 min’ – the 5 minutes come from the Cacti poller which is set to query for data each 5 minutes. The end result is something like this one :
On this real production chart you’ll see a few interesting patterns. For instance, at 3 o’clock in the morning, there is a huge spike in all the charted parameters – indeed, a cron’ed script was provoking this spike. From time to time, a small burst of slow queries is recorded – still under investigation. What is interesting here is that these spikes were previously undetectable on the load average chart, which look clean and innocuous:
To conclude, SNMP is a valuable resource for server performance monitoring. Often, investigating specific parameters and displaying them in tools such as Cacti can bring interesting insights upon the behavior of servers.
Some SNMP implementations in different programming languages:
  • Java: Westhawk’s Java SNMP stack [free w commercial support], AdventNet SNMP API [commercial, with a feature-restricted un-expiring free version], iREASONING SNMP API [commercial implementation], SNMP4J [free and feature-rich implementation - thank you Mathias for the tip]
  • PHP: client-only supported by the php-snmp extension, part of the PHP distribution [free]
  • Python: PySNMP is a Python SNMP framework, client+agents [free].
  • Ruby: client-only implementation Ruby SNMP [free]
1 If you’re running Debian, Cacti comes with apt so it’s a breeze to install and run [apt-get install cacti]
2 a bit out of the scope of this article, SNMP also allows writing values on remote servers, not only retrieving monitored values.
3 Replace [hostname] with the server hostname and [community_name] with the SNMP community – default being ‘public’. The SNMP community is a way of authenticating a client to a SNMP server; although the system can be used for pretty sophisticated stuff, most of the time the servers have a read-only passwordless community, visible only in the internal network for monitoring purposes.
4 In fact, a commercial implementation of SNMP for MySQL does exist.
5 The procedure described here applies to Cacti v0.8.6.c

| 0 comments ]

 
This is for graphing Cisco IP SLA Probes. For those of you who is not familiar with Cisco IP SLA, it is a probe s/w loaded on Cisco IOS based equipments that you can use to measure round trip times of various protocols/applications on the network. If you have 12.x your router/switch probably have IP SLA capability already present on the equipment, and you just need to create a probe entry. Cisco IP SLA has grown since its introduction in 11.x code (Yup, there are some 11.x code which can do IP SLA, back then called RTR), now it has about 15 or so probe types. Included is HTTP, DNS, ICMP, UDP, Jitter, FTP, DHCP, to name the few. Some you can run with single equipment, some you have to run with two equipments in a client server mode to get more accurate reading on the network health. Check out Emmanuel Tychon's page on more information on Cisco IP SLA:

http://www.etychon.com

I have created a new thread as I do not have access to user ID of original thread. But you can refer to the old thread for historical information on the template:

http://forums.cacti.net/about4136.html

I've added probe specific graph templates since the last time I've updated the templates. Here is the list of graph templates:

Basic - Use this for anything that does not fit in to specific templates (dhcp, tcp connect, etc.)
DNS - shows target DNS query
FTP - shows file size and URL
HTTP - break down of DNS resolve, TCP hand shake, and HTTP, and also shows page size, URL, and HTTP status code
Jitter - Shows source <-> destination positive/negative jitter
Jitter/Error - Shows RTT average value with max min grey band
VoIP Scoring - Shows MOS scoring and VoIP codec

Aside from jitter and http template, the main difference among other templates are the tag lines, which you can take advantage of by importing IP SLA mibs. I will post instructions shortly on how to import the mibs

Sample Basic & DNS statistics
Basic statistics
Use this template/probe to get response time for DHCP, PING (ICMP), TCP Connect and any other probes without matching graph template

DNS statistics
Use it to get response time for DNS probe. Sample config to resolve www.yahoo.com using 208.67.222.222 DNS server every 5 minutes with 100ms threshold:

ip sla monitor 232
type dns target-addr www.yahoo.com name-server 208.67.222.222
frequency 300
threshold 100
ip sla monitor schedule 232 life forever start-time now

Sample HTTP statistics
Use this template/probe to get response time breakdown of DNS lookup, TCP handshake, and HTTP get. Sample config to get home page of www.cisco.com without caching, resolve using 208.67.222.222 DNS server every 5 minutes with 500ms threshold:

ip sla monitor 456
type http operation get url http://www.cisco.com name-server 208.67.222.222 cache disable
threshold 500
frequency 300
ip sla monitor schedule 456 life forever start-time now

Sample Jitter & Jitter/Error statistics
Use this template/probe to get detailed response time and jitter statistics on the network. To make this work, you need to have other router running 'ip sla responder'. Best probe to measure overall network health and especially useful if you want to measure the network health for multimedia application, VoIP, and Video. Also, If you run this probe on WAN edge routers, you can compare SLA you get from the Cacti to the ones service provider presents. On the Jitter template the green line is statically setup at 30ms and -30ms as that seems to be the maximum recommended jitter value for VoIP application. Obviously my sample network isn't qualified for VoIP transmission based on the charts.

Sample config to get UDP Jitter statistics between local router and 10.0.0.2 (remote router running 'ip sla responder') every 5 minutes on port 10000.

ip sla monitor 1
type jitter dest-ipaddr 10.0.0.2 dest-port 10000
frequency 300
ip sla monitor schedule 1 life forever start-time now

Sample VoIP Scoring
This is really a subset of Jitter & Jitter/Error template/probe. You need to be running jitter probe with codec option. As a result you get MOS and ICPIF scoring with descriptions. Sample config to get VoIP scoring and UDP Jitter statistics between local router and 10.0.0.2 (remote router running 'ip sla responder') every 5 minutes on port 10004 using g729a codec with 160ms threshold:

ip sla monitor 3452
type jitter dest-ipaddr 10.0.0.2 dest-port 10004 codec g729a
threshold 160
frequency 300
ip sla monitor schedule 3452 life forever start-time now

Go to 'New Graphs', Select your IP SLA configured router, Edit this host, Add Data Query, select 'Cisco - IP SLA Statistics', click on add. Now you can click on 'Create Graphs for this Host', and you should see a screen like below with informative description of the probe instead of just numbers. Also, the description will be carried on the actual graph tag entries.


- Setup NTP on the equipments
- Use SNMPv2c instead of SNMPv1 if possible
- Setup threshold that makes sense, the default is 5000ms
- Use tag command to enter descriptive information of the IP SLA entry
- When using HTTP & FTP probe, use common sense on the size of the test files
- If QoS is enabled for VoIP traffic on the network, setup the VoIP probe to take advantage of the QoS

| 0 comments ]

The HP P2000 G3 is HP’s entry level SAN, it’s a robost piece of kit, as long as you keep the firmware updated.
Before we upgrade the SAN firmware, let’s run through a couple of items.

  1. Brick – It might happen, the SAN could become a brick after the firmware upgrade, always get a good backup of your data before you embark on the firmware upgrade.
  2. Downtime – Even though this can be done live, I recommend you arrange downtime, it’s just the sensible thing to do and gives you flexibility.
  3. Internet – This should go without saying, as you need to be able to download the drivers.
  4. Alarms/Monitoring – Turn this off for the SAN, as you will be inundated with emails/tickets.
Right then let’s crack on shall we.
First of all we need to download the right firmware at the time of writing this the TS240P003 has been released, this can be obtained from here
To make things slightly easier the one you want is in the red box below,.

After you have downloaded the firmware, we need to extract it, you can try the online flash, but for me it never works.

The file we care about is TS240P004-02.bin
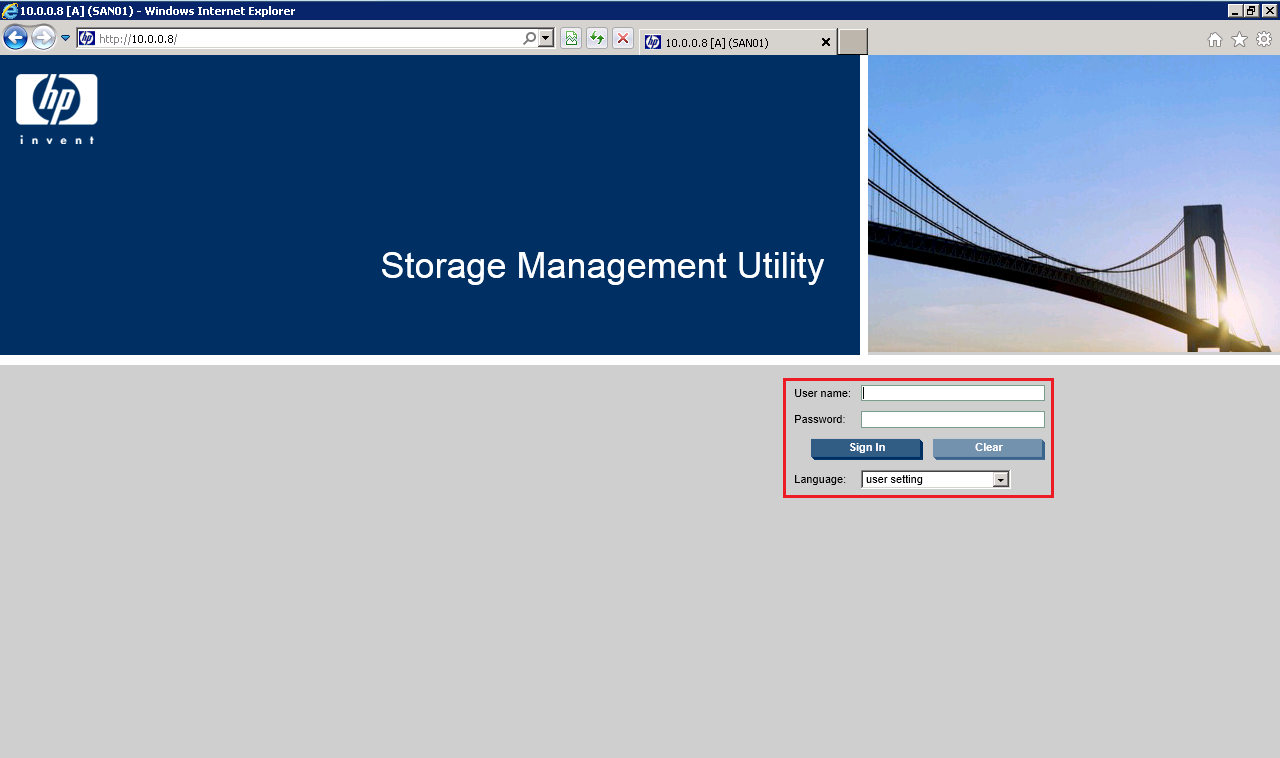
Log into your P2000 G3 by browsing to the IP Address of either Management Controller

Select the SAN name on the top left level and go to Tools > Update Firmware

At this point, I would double check that you have an straight upgrade path from your current contoller firmware to the one you intend to install.  I have checked mine so we are golden.
Click Browse to locate the TS240P004-02.bin file

TOP TIP: The controller you are logged into is the controller you will be upgrading the firmware on.
Click on OK and you will see the firmware being uploaded and applied, this can take some time so don’t worry.

Boom, it’s finished you should receive a ‘firmware update succeeded, restarting controller’

At this point you should have different versions of firmware on your controllers

TOP TIP: Check iSCSI or Fibre Channel access to your Volumes before you move onto the next controller.
Rinse and repeat for the next controller, and you should be golden.


Refer to http://vmfocus.com/2012/11/18/hp-p2000-g3-firmware-upgrade/